
- 08/10/2025
- MyFinanceGyan
- 895 Views
- 3 Likes
- Investment, Share Market
How to Show Entry and Exit Rules Using RSI Cross and Moving Average Crossover Examples: A Complete Guide
In stock trading, timing entry and exit points precisely is essential to maximize profits and minimize losses. Among the most popular technical analysis tools are the Relative Strength Index (RSI) and Moving Averages (MA). When used in combination, these indicators provide powerful, reliable signals that help traders decide when to buy or sell assets. This blog explores in detail how to show entry and exit rules using the RSI cross and MA crossover, with clear examples, explanations, and practical tips to apply these techniques confidently. Whether a beginner or experienced trader, understanding these rules will improve your market timing and trade management skills.
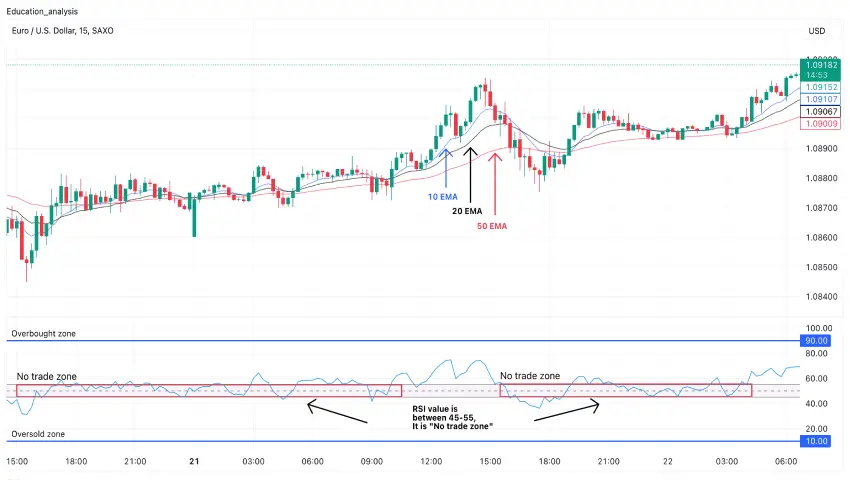
Understanding the Basics: RSI and Moving Averages:
What is RSI?
The Relative Strength Index (RSI), developed by J. Welles Wilder, is a momentum oscillator that measures the speed and change of price movements. It oscillates between 0 and 100 and is commonly used to identify:
- Overbought conditions: RSI usually above 70 signals the asset may be overvalued and due for a price pullback or reversal.
- Oversold conditions: RSI below 30 indicates potential undervaluation and a likely upward bounce.
- Momentum changes: RSI crossing key levels (30, 50, 70) often signals shifts in buying or selling pressure.
What are Moving Averages?
Moving averages smooth price data to help identify trends and possible reversal points. Key types include:
- Simple Moving Average (SMA): Arithmetic average of closing prices over a set period.
- Exponential Moving Average (EMA): Gives more weight to recent prices, reacting quicker to price changes than SMA.
Moving averages help determine:
- Trend direction: Price above MA indicates an uptrend; below MA indicates downtrend.
- Trend strength and changes: Crossovers between a short-term and a long-term MA signal potential trend reversals.
Why Combine RSI and Moving Averages?
Each indicator has its strengths but also limitations:
- RSI alone can produce false entries in strong trends where momentum stays overbought or oversold for long periods.
- Moving averages lag due to averaging, sometimes signaling late entries or exits.
Combining RSI and moving averages balances:
- Trend confirmation (moving averages give context if it’s a good time to buy/sell).
- Momentum timing (RSI indicates when momentum is shifting).
Together, they offer a filter system to take higher-probability trades by confirming both trend and momentum.
Defining Entry Rules Using RSI Cross & MA Crossover:
Step 1: Confirm the Trend Using Moving Average Crossover:
- Use a short-term MA (like 10-day EMA) and a long-term MA (like 20-day EMA or 50-day SMA).
- A bullish crossover (short MA crossing above long MA) signals an emerging uptrend — a prerequisite to looking for long entries.
- A bearish crossover (short MA crossing below long MA) signals downtrend — focus on short positions or exits from long trades.
Example: On Day 15, the 10-day EMA crosses above the 20-day EMA, indicating a potential start of bullish momentum. This sets the stage for looking at RSI for entry confirmation.
Step 2: Look for RSI Cross to Time Entry:
- For long trades, look for RSI crossing above 30 or 40 from below, indicating momentum is leaving oversold territory and buyers are returning.
- For short trades, look for RSI crossing below 70 or 60 from above, signaling momentum fading and potential selling pressure.
Wait for the RSI crossover after the MA crossover for confirmation, reducing false signals.
Step 3: Execute Entry:
- Enter a long position on the next candle open after both conditions (MA bullish crossover + RSI cross above threshold) are met.
- Enter a short position following the opposite signals (MA bearish crossover + RSI cross below threshold).
Defining Exit Rules Using RSI and MA Crossovers:
Exit by Moving Average Cross:
- Exit a long trade when the short-term MA crosses below the longer-term MA, signaling a potential trend reversal or weakening momentum.
- Exit short trades on the opposite crossover.
Exit by RSI Cross:
- For longs, exit if RSI crosses below 60 or 50, indicating a loss of buying momentum.
- For shorts, exit if RSI crosses above 40-50, indicating a weakening downtrend.
Example Scenario: Combining Entry and Exit Rules:
Day Price 10 EMA 20 EMA RSI Signal Action
14 100 99 100 35 RSI rising, but 10 EMA below 20 EMA Wait
15 102 100 99 42 10 EMA crosses above 20 EMA, RSI crosses above 40 Enter Long at next open
20 110 107 105 65 RSI close to 70, momentum intact Hold
25 115 108 109 59 RSI crosses below 60 Exit part or all
27 113 106 108 52 10 EMA crosses below 20 EMA Exit remaining
Visual Aids and Chart Annotations:
Showing entry/exit points is simpler when accompanied by:
- Chart annotations: Mark MA crossovers with arrows or circles.
- RSI indicator panel: Highlight RSI cross points with vertical lines.
- Trade arrows: Green arrows for entries and red for exits on price chart.
- Stop-loss and target lines: Visualize trade management levels.
These make it easier to explain and backtest signals.
Practical Tips for Traders:
- Use multiple timeframes: Confirm higher timeframe trends and apply RSI/MA signals on your trading timeframe.
- Combine with support/resistance levels to improve signal validity.
- Backtest your rules extensively to avoid curve-fitting.
- Use stop-losses based on recent lows/highs or moving averages for risk control.
- Avoid trading when either MA or RSI signals conflict or show weak momentum.
Conclusion:
Showing entry and exit rules using RSI cross and moving average crossovers is a practical, rule-based way to trade trends with momentum confirmation. This combination reduces false alarms and helps filter trades aligned with strong market moves. Clear rules backed by visual examples enhance understanding, discipline, and potentially improve trading success.
Please note,
The views in the article/blog are personal and that of the author. The idea is to create awareness and for educational purpose and not intended to provide any product recommendations.