
- 01/10/2025
- MyFinanceGyan
- 513 Views
- 2 Likes
- Investment, Share Market
Fibonacci Extensions in Trading: A Comprehensive Guide
Fibonacci tools remain among the most trusted techniques in technical analysis. While most traders are familiar with retracement levels like 38.2%, 50%, and 61.8%, the concept of Fibonacci extensions is equally powerful — yet often underutilized. Extensions help traders project future price targets beyond retracements, offering clear levels for setting profit goals and anticipating reversals. This guide explains what Fibonacci extensions are, how to calculate and apply them, strategies to use them effectively, real-world examples, and common mistakes to avoid.
What Are Fibonacci Extensions?
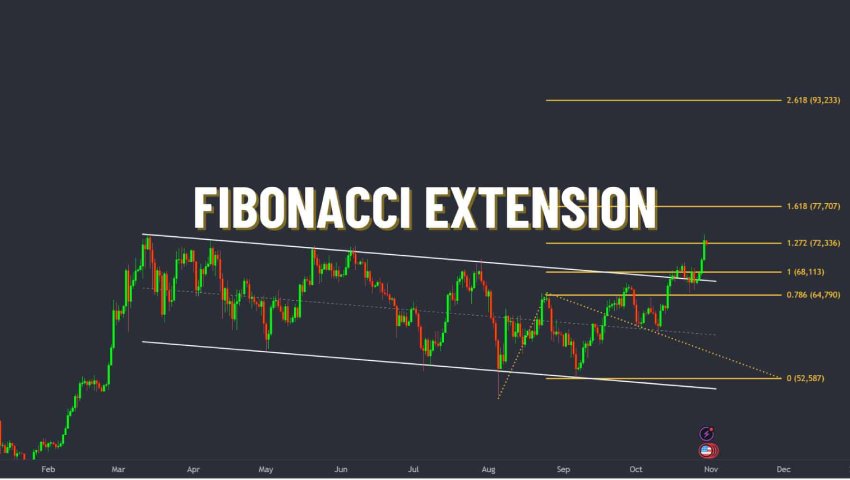
Fibonacci extensions are horizontal levels plotted on a chart to estimate where price might travel after a retracement. Unlike retracements, which measure pullbacks, extensions project how far the next leg of the trend could continue.
Key Fibonacci extension levels:
- 127.2%
- 138.2%
- 150%
- 161.8% (the “Golden Ratio”)
- 200%
- 261.8%
These levels act as potential targets or resistance/support zones, helping traders plan exits, lock profits, or spot trend exhaustion.
How to Plot Fibonacci Extensions:
To draw Fibonacci extensions, traders need three reference points:
- Point A: Start of the initial move (swing low in an uptrend, swing high in a downtrend).
- Point B: End of the move (swing high in an uptrend, swing low in a downtrend).
- Point C: End of the retracement.
Example: Uptrend
- Swing Low (A): ₹100
- Swing High (B): ₹150
- Retracement Low (C): ₹130
Formula:
Extension Level=C+(B−A)×Fibonacci Ratio\text{Extension Level} = C + (B – A) \times \text{Fibonacci Ratio}Extension Level=C+(B−A)×Fibonacci Ratio161.8% extension = 130 + (150 − 100) × 1.618 = ₹210.9
Example: Downtrend
- Swing High (A): ₹200
- Swing Low (B): ₹150
- Retracement High (C): ₹170
Formula:
Extension Level=C−(A−B)×Fibonacci Ratio\text{Extension Level} = C − (A – B) \times \text{Fibonacci Ratio}Extension Level=C−(A−B)×Fibonacci RatioTools to Use
Popular platforms like TradingView, Zerodha Varsity, Angel One, and Upstox Pro provide built-in Fibonacci extension tools. Simply select points A, B, and C, and the levels are automatically plotted.
How Traders Use Fibonacci Extensions:
Setting Profit Targets:
- Book partial profits near 127.2%.
- Major profit zones often lie at 161.8%.
- Watch 200% and 261.8% for trend exhaustion.
Confirming Trend Continuation:
- If price breaks through one extension level and respects the next, it signals a strong continuation.
Entry and Exit Strategy:
- Enter after price retraces to a Fibonacci retracement level.
- Use extensions (e.g., 161.8%) as profit targets.
- Place stop-loss below retracement lows (in uptrends).
Enhancing Fibonacci Extensions with Other Tools:
- Volume: Surges near extensions confirm strength of moves.
- Oscillators (RSI, MACD): Help spot overbought/oversold conditions.
- Moving Averages & Trendlines: When they intersect with extensions, levels become stronger.
Real-World Example (Indian Market):
A stock moves:
- Point A = ₹200 → Point B = ₹300 → Retraces to Point C = ₹260
- 127.2% Extension = 260 + (300 − 200) × 1.272 = ₹387.2
- 161.8% Extension = 260 + (300 − 200) × 1.618 = ₹421.8
A trader entering at ₹260 can target profits around ₹387 and ₹422 while adjusting stop-losses.
Advanced Fibonacci Extension Strategies:
- Multiple Time Frames: Cross-check daily and weekly charts for confluence.
- Elliott Wave Theory: Extensions align naturally — e.g., Wave 3 often extends to 161.8% of Wave 1.
- Breakout Trading: After a breakout, extensions help forecast post-breakout targets.
Risk Management with Extensions:
- Always set stop-losses near retracement lows/highs.
- Lock partial profits at early levels (127.2%).
- Trail stop-losses as price approaches higher extensions.
Common Mistakes to Avoid:
- Picking wrong swing points → leads to unreliable levels.
- Using in sideways/range-bound markets → best suited for trends.
- Relying only on Fibonacci → combine with other confirmations.
- Ignoring risk management → over-leverage can be dangerous.
- Expecting all levels to hit → treat them as guides, not guarantees.
Conclusion:
Fibonacci extensions provide objective, math-based price projections, helping traders define targets, manage exits, and confirm trend strength. When integrated with retracements, volume, and momentum indicators, they create a solid framework for smart trading decisions. The key lies in:
- Correctly identifying swing points.
- Applying them in trending markets.
- Managing risk with discipline.
With consistent practice, Fibonacci extensions can become a trusted compass for navigating markets, whether in stocks, forex, or crypto.
Disclaimer: The views expressed in this article are personal and educational. They are not financial advice or product recommendations.