
- 09/05/2025
- MyFinanceGyan
- 735 Views
- 1 Likes
- Share Market
Support and Resistance in the Share Market – Made Simple
In the share market, many people use technical analysis to decide when to buy or sell stocks. One of the most important tools in this method is understanding support and resistance levels. These levels help traders figure out where the price of a stock might stop falling or rising — which makes it easier to plan trades.
Let’s understand what they mean, how to find them, and why they matter.
What is Support and Resistance?
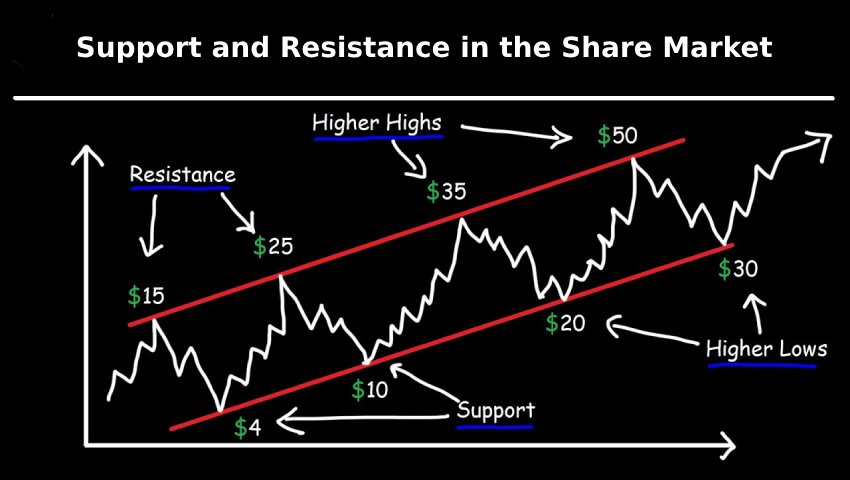
Support Level: Support is a price point where a stock usually stops falling and starts to rise again. Think of it like a floor that supports the price. This happens because buyers find the stock attractive at that level and start buying.
Example: If a stock drops to ₹500 and then bounces back several times, ₹500 becomes the support level.
Resistance Level: Resistance is the opposite — it’s like a ceiling where the stock price often stops rising and starts to fall. Sellers start selling at this point, which creates pressure on the price.
Example: If a stock keeps failing to go above ₹750, then ₹750 is the resistance level.
Why Are These Levels Important?
- Entry and Exit Points: Traders buy near support and sell near resistance.
- Spotting Trend Changes: If price breaks above resistance or below support, a new trend may begin.
- Risk Control: These levels help set stop-loss and target prices to manage risk.
How to Find Support and Resistance?
These levels aren’t always exact prices — they are more like zones. Here are some ways to spot them:
- Past Price Points: Look at where the price has reversed in the past.
- Trendlines: Drawing lines along highs or lows can show support and resistance.
- Moving Averages: Common ones like 50-day or 200-day averages often act as support or resistance.
- Fibonacci Levels: These are calculated levels that often match key price zones.
- Volume: Areas with high trading volume often act as strong support or resistance.
Support & Resistance in Different Market Trends:
- Uptrend: Old resistance becomes new support after a breakout.
- Downtrend: Old support becomes new resistance after a breakdown.
- Sideways Market: Price moves between a fixed support and resistance range.
Breakouts and False Breakouts:
- A breakout happens when the price moves above resistance or below support — often signaling a strong move.
- A false breakout looks like a real one, but the price quickly reverses.
To avoid false breakouts:
- Check if trading volume is high.
- Wait for a full candle to close beyond the level.
- Use indicators like RSI or MACD for confirmation.
Trading Strategies Using These Levels:
- Range Trading: Buy near support, sell near resistance.
- Breakout Trading: Enter a trade when the price breaks support/resistance.
- Pullback Trading: Enter the trade when price comes back (pulls back) to the broken level.
Why These Levels Work – Psychology Behind It?
- Fear & Greed: Traders remember how prices reacted in the past and act the same again.
- Group Thinking: When many traders act at the same level, it becomes stronger.
- Beliefs: Traders expect price to behave the same way again — and often it does.
Limitations of Support & Resistance:
- Not always exact numbers.
- Different people may see different levels.
- May not work well during sudden news events.
Solution: Always use them with other tools like RSI, MACD, candlestick patterns, etc.
Final Thoughts:
Support and resistance are basic but powerful concepts in the stock market. They help traders figure out good times to enter or exit trades. While they are not perfect, combining them with other tools and using proper risk management can lead to better trading decisions.
Learning how to use support and resistance can give you an edge in trading and help you grow as a smarter investor.
Disclaimer: This article is for awareness and education only. It is not financial advice or a recommendation to buy any investment.