
- 11/10/2025
- MyFinanceGyan
- 350 Views
- 4 Likes
- Share Market
Technical Analysis Using Historical Pricing: Tools, Techniques, and Applications
Technical analysis is a cornerstone strategy for traders and investors seeking to forecast future market movements by analyzing past price behavior. At its core lies historical pricing, which captures previous price action, trends, and volume to uncover opportunities and manage risk. This guide explains how historical pricing forms the foundation of technical analysis, the key tools and techniques, practical applications, and tips for leveraging these insights effectively.
Understanding the Role of Historical Pricing:
Historical pricing refers to the recorded price data of a financial asset over time, including:
- Open price: First traded price of the period
- Close price: Final price, reflecting market sentiment
- High and low prices: Price extremes for the period
- Volume: Total trading activity
Technical analysis uses this data to identify patterns and trends because markets often display recurring behavior driven by human psychology. By analyzing history, traders can make statistically informed predictions about future price movements.
Why Historical Pricing Matters?
- Trend Identification: Detect uptrends, downtrends, or sideways markets.
- Entry and Exit Signals: Spot optimal buy or sell points using patterns or indicators.
- Risk Management: Set stop-loss and take-profit levels based on past volatility.
- Backtesting & Strategy Development: Test trading strategies on historical data before live execution.
Key Tools of Technical Analysis:
Price Charts:
Charts provide a visual representation of historical prices:
- Line Charts: Connect closing prices to show overall trends.
- Bar Charts: Display open, high, low, and close prices for detailed analysis.
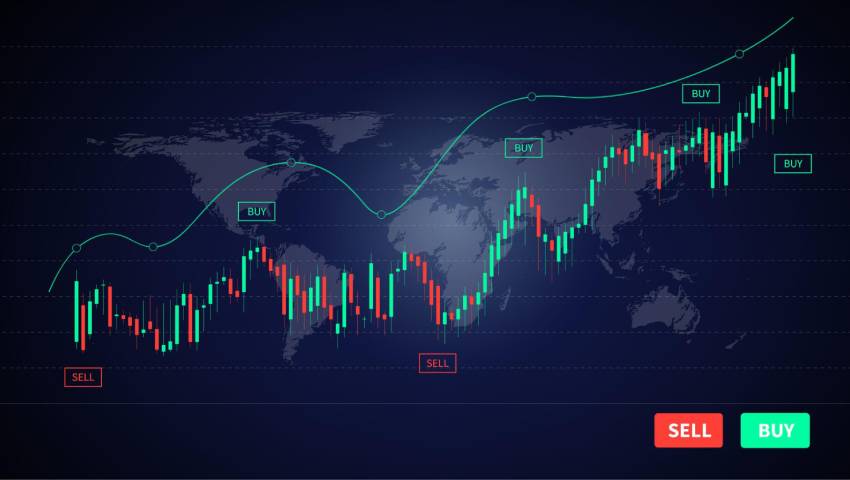
- Candlestick Charts: Highlight market sentiment; patterns such as doji, hammer, and engulfing help predict reversals or continuations.
Trend Analysis Tools:
Trend analysis identifies the direction and strength of price movements:
- Moving Averages (MA): Smooth price data over time (e.g., 50-day, 200-day).
- Crossovers: Signals occur when short-term MAs cross long-term MAs.
- Trendlines: Connect significant highs or lows to visualize support/resistance.
- Average Directional Index (ADX): Measures trend strength, distinguishing trending vs. range-bound markets.
Volume-Based Indicators:
Volume confirms the reliability of price movements:
- On-Balance Volume (OBV): Tracks cumulative volume flow to validate trends.
- Volume Weighted Average Price (VWAP): Highlights fair value for intraday trading.
Momentum Oscillators:
These indicators gauge the speed and magnitude of price changes:
- Relative Strength Index (RSI): 0–100 scale; >70 indicates overbought, <30 oversold.
- MACD (Moving Average Convergence Divergence): Highlights trend changes through crossovers/divergences.
- Stochastic Oscillator: Compares close price to the range, signaling potential reversals.
Chart Patterns & Candlestick Patterns:
Historic price shapes reveal potential market behavior:
- Reversal Patterns: Head & shoulders, double tops/bottoms, doji, hammer.
- Continuation Patterns: Triangles, flags, and pennants suggest trend resumption.
Fibonacci Retracement:
Fibonacci levels identify potential support and resistance zones using retracement ratios (23.6%, 38.2%, 50%, 61.8%, 78.6%). Traders use these to anticipate trend reversals or continuation points.
Tools and Platforms for Historical Price Analysis:
Traders have access to several platforms to efficiently analyze historical pricing:
- Charting Platforms: TradingView, MetaTrader, ThinkorSwim
- Financial Websites: Yahoo Finance, Google Finance
- Data APIs: Alpha Vantage, Financial Modeling Prep for algorithmic trading
- Brokerage Tools: Many brokers provide built-in charting and analysis
- AI-Powered Software: Scans for breakout stocks, trend shifts, and momentum changes
Practical Applications of Historical Pricing:
- Strategy Development & Backtesting: Simulate past trades to validate strategy effectiveness.
- Entry & Exit Timing: Use historical support/resistance, trendlines, and indicators for precise trade execution.
- Risk & Money Management: Historical volatility helps determine stop-loss levels and position sizes to manage potential losses.
Limitations of Technical Analysis:
- Past Performance Isn’t Predictive: Historical trends do not guarantee future outcomes.
- External Events Impact Prices: News, economic shifts, or company events can invalidate patterns.
- Self-Fulfilling Prophecies: Popular patterns may influence market behavior but can generate false signals.
Tip: Combine technical analysis with fundamental analysis and sentiment analysis for a comprehensive trading approach.
Tips for Effective Technical Analysis:
- Use Multiple Timeframes: Long-term charts for trends, short-term charts for timing.
- Combine Indicators: Trend + momentum + volume confirmation improves accuracy.
- Practice Discipline: Stick to your trading plan; avoid overtrading.
- Continual Learning: Adapt strategies as markets evolve.
- Manage Risk: Always set stop-losses and limit capital exposure per trade.
Conclusion:
Historical pricing is the backbone of technical analysis. Tools like charts, moving averages, oscillators, volume indicators, candlestick patterns, and Fibonacci retracements empower traders to anticipate price behavior. While not foolproof, combining these tools with disciplined execution and risk management allows traders to navigate volatile markets with greater confidence.
Mastering technical analysis using historical pricing equips both novice and experienced traders to make informed, data-driven decisions and achieve consistent trading success.
Disclaimer: The content is for educational purposes only. Views expressed are personal and not intended as financial advice or product recommendations.