
- 08/11/2025
- MyFinanceGyan
- 300 Views
- 0 Likes
- Share Market
What Is an Oscillator Indicator in Trading? — Explained Simply
In financial markets, traders rely on technical indicators to analyze price movements and make smart trading decisions. Among these, oscillator indicators stand out as some of the most powerful tools for identifying momentum, trend reversals, and overbought or oversold conditions.
Oscillators are especially useful when markets are range-bound or volatile, helping traders identify turning points that might not be visible on price charts alone. This guide explains what oscillator indicators are, how they work, their types, key examples, and strategies to use them effectively.
What is an Oscillator Indicator?
An oscillator is a technical indicator that moves back and forth between fixed limits — usually 0 and 100 — to show momentum shifts in price movements.
It measures how quickly prices are changing and whether an asset is overbought (too expensive) or oversold (too cheap).
- When values approach the upper limit, it signals potential price weakness or reversal.
- When values move near the lower limit, it indicates possible recovery or buying opportunity.
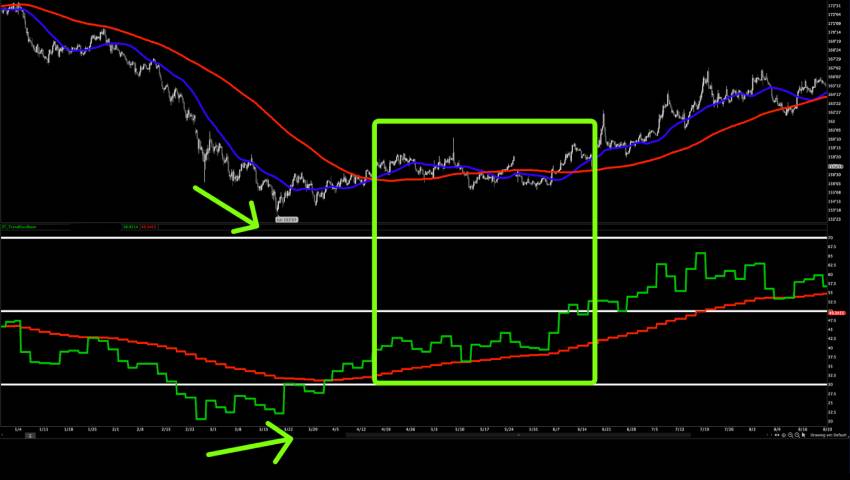
Oscillators are plotted in a separate pane below the price chart, making it easy to interpret momentum independently from the price itself.
Key Characteristics:
- Bounded Range: Typically moves between fixed upper and lower levels.
- Momentum-Based: Measures rate of price change, not price itself.
- Overbought/Oversold Signals: Helps identify extremes.
- Independent Display: Shown below price chart.
- Non-Trending Behavior: Oscillators revert between extremes rather than trend endlessly.
Types of Oscillator Indicators:
Banded Oscillators (Fixed Limits):
These oscillate between 0 and 100 to identify extremes:
- Relative Strength Index (RSI): Overbought above 70, oversold below 30.
- Stochastic Oscillator: Overbought above 80, oversold below 20.
- Commodity Channel Index (CCI): Overbought above +100, oversold below –100.
- Williams %R: Similar to Stochastic but on a scale of 0 to –100.
Centered Oscillators (Around Zero Line):
These fluctuate around a centerline (usually zero) to show positive or negative momentum:
- MACD (Moving Average Convergence Divergence): Measures difference between two EMAs.
- Rate of Change (ROC): Percentage change in price over time.
- Awesome Oscillator (AO): Difference between two SMAs to gauge market strength.
How Oscillators Work?
Oscillators convert price data into statistical momentum readings.
They generate trading signals when:
- Crossovers occur (e.g., MACD line crossing above zero).
- Divergences appear (price makes a new high but oscillator doesn’t).
- Extremes are reached (values near 0 or 100).
These signals help traders anticipate potential trend reversals or continuations.
Popular Oscillator Examples
- RSI: Ideal for quick momentum reading and spotting divergences.
- MACD: Best for confirming trend strength.
- Stochastic: Helps find early entry and exit points.
- CCI: Detects cyclical overbought and oversold movements.
Trading Strategies:
- Overbought/Oversold Reversal: Buy when oscillator exits oversold zone; sell when it exits overbought.
- Divergence Trading: Buy on bullish divergence (price lower lows, oscillator higher lows). Sell on bearish divergence (price higher highs, oscillator lower highs).
- Trend Confirmation: Use oscillators with moving averages — e.g., RSI above 50 confirms uptrend.
- Crossover Strategy: Trade MACD or Stochastic line crossovers for momentum entries.
Pros and Cons:
Advantages:
- Detects early trend reversals.
- Works well in sideways markets.
- Easy visual interpretation.
- Applicable to all asset classes.
Limitations:
- False signals in strong trends.
- Needs confirmation with other indicators.
- Sensitive to parameter settings.
Conclusion:
Oscillator indicators like RSI, MACD, Stochastic, and CCI are essential tools for understanding market momentum and timing trades effectively. When used alongside price action, moving averages, and volume analysis, oscillators help traders gain precision and discipline in volatile markets.
Disclaimer: The content above is intended solely for educational and informational purposes. It does not constitute financial advice or a recommendation to invest in any specific IPO.