
- 06/05/2025
- MyFinanceGyan
- 692 Views
- 1 Likes
- Share Market
What is RSI in Share Trading? A Simple Guide for Investors?
In the fast-moving world of share trading, investors use different tools to make smart decisions. One important tool is the Relative Strength Index (RSI). It helps traders understand if a stock is overbought (price too high) or oversold (price too low).
Understanding RSI in the Share Market:
RSI is a tool that measures how fast and how much a stock’s price is changing. It was created by J. Welles Wilder in 1978 and shows a value between 0 and 100. The main goal of RSI is to find out:
- When a stock might be too expensive (overbought)
- When a stock might be too cheap (oversold)
How is RSI calculated?
- It compares the average gains and losses over a period of time (usually 14 days).
How RSI Works?
Here’s what the RSI number tells you:
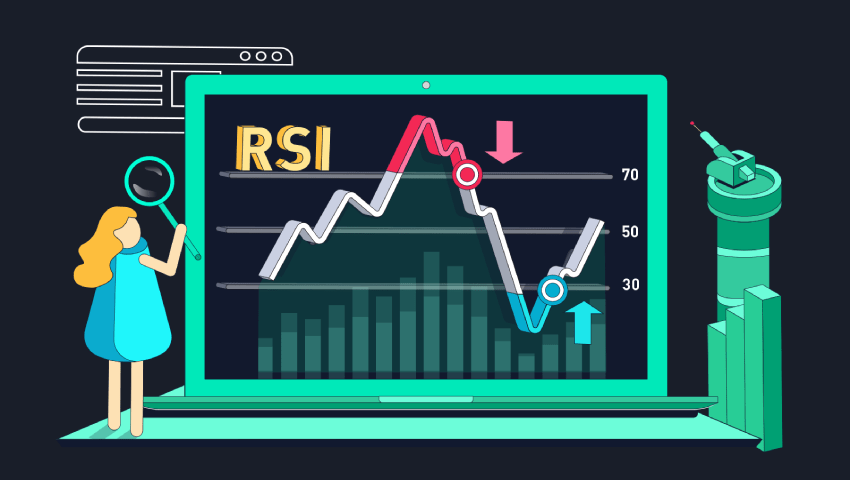
- RSI above 70: Stock might be overbought (price may soon fall).
- RSI below 30: Stock might be oversold (price may soon rise).
Traders use RSI to:
- Spot trends
- Decide the best times to buy or sell
- Avoid buying when prices are too high or selling when prices are too low
How to Read RSI?
Overbought and Oversold Levels:
- Above 70: The stock may be overvalued. It might be a good time to sell.
- Below 30: The stock may be undervalued. It might be a good time to buy.
RSI Divergence:
- Bullish Divergence: Stock price makes lower lows, but RSI makes higher lows. This could mean the stock might start going up.
- Bearish Divergence: Stock price makes higher highs, but RSI makes lower highs. This could mean the stock might start falling.
RSI Swing Rejection:
- Bullish Swing Rejection: RSI goes below 30, moves up, drops again but stays above the last low, then rises again — possible buying signal.
- Bearish Swing Rejection: RSI goes above 70, falls, rises again but stays below the last high, then falls again — possible selling signal.
Examples of Using RSI:
- Example 1: Overbought Stock: Stock ABC has an RSI of 85. This means it’s likely overbought. Traders might sell it or set a stop-loss.
- Example 2: Oversold Stock: Stock XYZ has an RSI of 25. It could be undervalued. Investors might prepare to buy it if signs of a price recovery appear.
- Example 3: RSI Divergence: Stock PQR is making lower lows, but its RSI is making higher lows. This could signal a possible trend reversal upwards.
Best Practices When Using RSI:
Use RSI with Other Tools:
- Combine with moving averages, MACD, or support and resistance levels to confirm signals.
Use RSI on Different Time Frames:
- Short-term traders: Check RSI on 5-minute, 15-minute, or hourly charts.
- Long-term investors: Check RSI on daily or weekly charts.
Be Careful of False Signals:
- Sometimes, stocks stay overbought or oversold for a long time. Always wait for confirmation before acting.
Adjust the RSI Settings:
- Default setting is 14 periods.
- For faster signals: use 7–10 periods (good for short-term trading).
- For smoother signals: use 20–30 periods (good for long-term investing).
Understand the Limitations:
- Best in Sideways Markets: RSI works well when prices move in a range, not in strong uptrends or downtrends.
- Can Give False Signals: Always double-check with other indicators.
- Lagging Indicator: RSI is based on past data, so it might not always predict the future accurately.
Conclusion:
The Relative Strength Index (RSI) is a useful tool for finding overbought and oversold conditions in the stock market. It helps traders and investors spot possible price changes and make better decisions.
However, RSI works best when combined with other tools. It should not be the only factor in your trading or investing decisions.
Note: This article is for educational purposes only and does not offer specific financial advice.