
- 09/08/2025
- MyFinanceGyan
- 466 Views
- 2 Likes
- Share Market
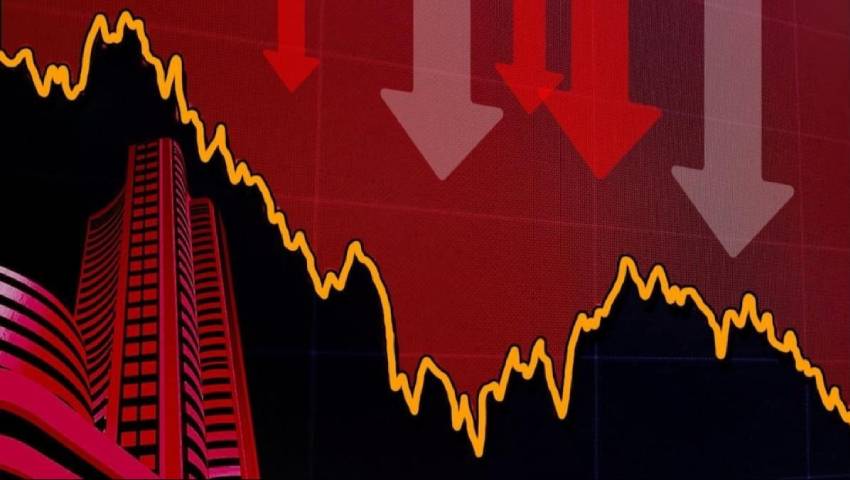
Breakdown in Share Market
The stock market is constantly shifting. Prices rise and fall based on investor sentiment, news, and supply-demand dynamics. While many focus on rising prices, it’s equally important to understand when prices are about to fall — and that’s where the concept of a breakdown comes in.
This blog explains what a breakdown is, why it matters, and how you can identify and trade it effectively.
What is a Breakdown in the Share Market?
A breakdown occurs when a stock or index falls below a key support level with strong volume. This usually signals the start of a bearish trend or further downside.
“A breakdown is a bearish technical signal that indicates price weakness after a key support level is breached.”
Why Understanding Breakdowns Is Important?
Recognizing a breakdown can help you:
- Exit before deeper losses
- Take short positions in falling markets
- Confirm trend reversals
- Protect your portfolio using stop-loss triggers
In short, breakdowns are powerful tools for risk management and profit opportunities during market declines.
How to Identify a Breakdown?
To spot a reliable breakdown, look for:
- Support Breach: Price falls below a support zone tested multiple times
- Volume Spike: Volume rises significantly during the breakdown
- Candle Confirmation: Wait for a daily or weekly close below the support level
Types of Breakdowns:
1. Price Breakdown
The most basic type — price moves below horizontal support.
2. Chart Pattern Breakdown
Breakdowns that follow reversal patterns like:
- Head and Shoulders
- Double Top
- Bear Flag
- Rising Wedge
3. News-Based Breakdown
Caused by poor earnings, regulations, or negative news.
Breakout vs Breakdown: Key Differences
Chart Patterns That Lead to Breakdowns:
- Head & Shoulders (Top): Breakdown occurs below the neckline
- Rising Wedge: Breakdown below lower trendline
- Rectangle Range: Breakdown at bottom of sideways zone
- Double Top: Bearish signal when neckline breaks
How to Trade a Breakdown?
- Step 1: Identify support level (use chart history)
- Step 2: Watch for a close below support with high volume
- Step 3: Enter a short trade or exit long positions
- Step 4: Place a stop-loss just above the broken support
- Step 5: Set realistic targets using past lows or Fibonacci levels
Beware of False Breakdowns:
Sometimes, prices dip below support but quickly reverse — this is a false breakdown.
How to avoid them:
- Confirm with volume
- Wait for 2 candles to close below support
- Use RSI or MACD divergence as secondary checks
Best Indicators to Confirm Breakdowns:
- Volume: Should spike on the breakdown
- RSI: Falling below 30 can confirm bearish strength
- Moving Averages: Price falling below 50- or 200-day MA strengthens the signal
Breakdown Trading in Intraday:
Intraday traders use breakdowns for quick profits:
- Use the previous day’s low or the first 15-minute range as support
- Enter short trades when this level is broken with volume
- Keep stop-loss tight due to high intraday volatility
Works well with high-volume stocks like Reliance, Infosys, or Nifty Futures.
Breakdowns for Long-Term Investors:
Breakdowns matter to investors too. If a fundamentally strong stock breaks its 200-day moving average with volume, it may signal a deeper correction.
- Exit or reduce exposure temporarily
- Re-enter at better valuations
- Helps protect long-term capital during bear markets
Advantages of Breakdown Trading:
- Early entry in downtrends
- Helps avoid major losses
- Works across timeframes (intraday to long-term)
- Useful with technical patterns
Risks of Breakdown Trading:
- False breakdowns may trigger stop-losses
- High volatility = emotional trades
- Requires quick thinking and chart-reading skills
Conclusion:
A breakdown is a valuable signal for spotting bearish moves and protecting your portfolio. Whether you’re a trader seeking quick gains or an investor avoiding steep losses, mastering breakdowns gives you an edge.
But remember: confirmation is key. Use volume, chart patterns, and indicators like RSI or moving averages to validate the signal. Combined with risk management, breakdown strategies can enhance your market performance in falling conditions.
FAQs on Breakdown in Share Market
A potential start of a downward trend after support is broken.
Watch for a close below support with volume and use technical indicators for confirmation.
Yes — they may signal pullbacks or trend reversals.
Usually not. It’s better to wait for trend reversal signs.
Yes, especially when combined with volume and news-based setups.