
- 04/10/2025
- MyFinanceGyan
- 1108 Views
- 5 Likes
- Investment, Share Market
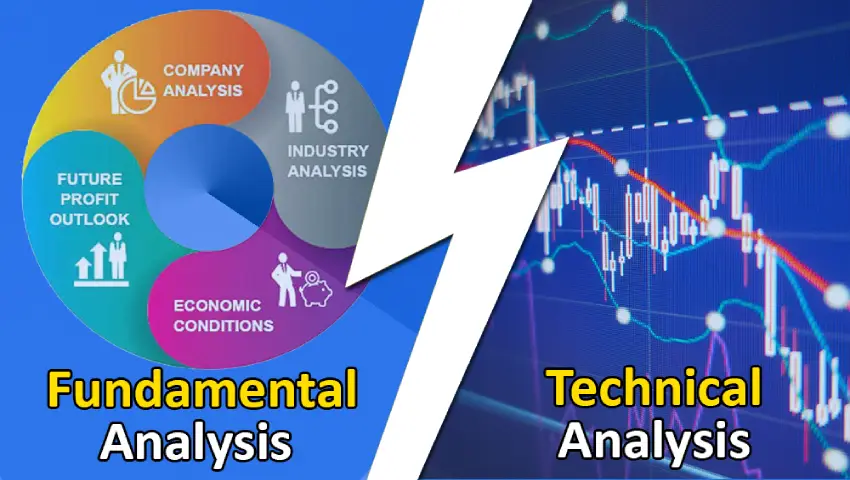
Fundamental Analysis vs Technical Analysis: Key Differences Every Investor Should Know
Investors and traders in the financial markets often choose between two primary approaches—fundamental analysis vs technical analysis. Both are designed to guide buy or sell decisions for stocks, bonds, or commodities, but their philosophy, methods, time horizon, and decision-making criteria differ significantly. Understanding these differences can help you design an investment strategy, manage risks better, and improve market timing. Let’s explore how fundamental analysis and technical analysis differ, their pros and cons, and how they can complement each other.
What Is Fundamental Analysis?
Fundamental analysis focuses on evaluating the intrinsic value of an asset. It looks at economic, financial, and qualitative factors to answer the question:
What is this security truly worth?
Analysts study company revenue, earnings, assets, liabilities, cash flow, industry trends, and the broader economy. If the market price is below the calculated intrinsic value, the asset is considered undervalued and vice versa. This approach is usually associated with long-term investing—holding quality businesses until the market eventually reflects their true worth.
What Is Technical Analysis?
Technical analysis studies historical price movements, volume trends, and chart patterns to forecast future price action. It asks a different question:
What is the price likely to do next?
The method assumes all available information is already reflected in the price. Since human behavior in markets often repeats, past patterns are believed to predict future trends. Traders rely on tools like candlestick charts, indicators (RSI, MACD, moving averages), and price patterns (head & shoulders, triangles, flags) to make short- to medium-term trading decisions.
Fundamental vs. Technical Analysis: A Side-by-Side Comparison:
Philosophical Differences:
- Fundamental Analysis Belief: Prices eventually align with a company’s intrinsic value. Market inefficiencies are opportunities for patient investors. Popularized by Benjamin Graham and Warren Buffett, it emphasizes value investing.
- Technical Analysis Belief: All known information is priced in, and market psychology (fear, greed, optimism) creates repeating trends. It focuses less on why a move happens and more on when to act.
Inputs and Tools:
Fundamental Analysis Uses:
- Financial Statements (income, balance sheet, cash flow)
- Ratios (P/E, P/B, RoE, Debt-to-Equity)
- Economic Data (GDP growth, inflation, interest rates)
- Industry Trends and qualitative factors (management, brand strength)
Technical Analysis Uses:
- Charts (line, bar, candlestick)
- Indicators (MACD, RSI, Bollinger Bands)
- Patterns (double tops, head & shoulders, triangles)
- Volume analysis, support/resistance, and trendlines
Time Frames and Strategies:
- Fundamental analysis works best for long-term horizons. Investors hold stocks for years to allow value realization.
- Technical analysis applies across multiple time frames—from intraday trades to swing trades lasting days or weeks.
Strengths and Weaknesses:
Fundamental Analysis – Strengths
- Gives deep insight into business health
- Helps identify undervalued assets
- Builds long-term wealth
- Accounts for economic & industry factors
Fundamental Analysis – Weaknesses
- Requires time and expertise
- Prices may stay irrational for long periods
- Not ideal for short-term trading
- Vulnerable to sudden shocks or sentiment shifts
Technical Analysis – Strengths
- Excellent for timing entry/exit points
- Works well in volatile conditions
- Based purely on price (unbiased by company narratives)
- Applicable across markets and time frames
Technical Analysis – Weaknesses
- Ignores fundamentals and intrinsic value
- False signals can mislead
- Patterns may be subjective
- Frequent trading increases costs
Combining Both Approaches:
Many investors use a hybrid strategy:
- Fundamental analysis to decide what to buy (quality companies with growth potential).
- Technical analysis to decide when to buy or sell (optimal entry/exit points).
This combination offers the best of both worlds—conviction in the asset plus precision in timing.
Real-World Examples:
Case 1 – Fundamental Approach:
- Investor A finds Company XYZ with strong revenues, low debt, and a P/E below industry average. Despite a short-term dip, they buy and hold, reaping rewards as the company grows.
Case 2 – Technical Approach:
- Trader B spots a breakout in XYZ’s chart above resistance with strong volume. Indicators like RSI confirm bullish momentum. They enter for a short-term gain and exit once momentum weakens.
When to Use Each:
Conclusion:
Fundamental analysis answers: “What should this stock be worth?”
Technical analysis answers: “When should I buy or sell this stock?”
Each has strengths and limitations. Long-term investors often prefer fundamental analysis, while short-term traders rely on technicals. However, combining both approaches can help balance conviction with timing. By understanding how fundamental and technical analysis differ, you can create strategies aligned with your goals, time horizon, and risk appetite—bringing you one step closer to success in dynamic markets.