
- 05/05/2025
- MyFinanceGyan
- 533 Views
- 1 Likes
- Share Market
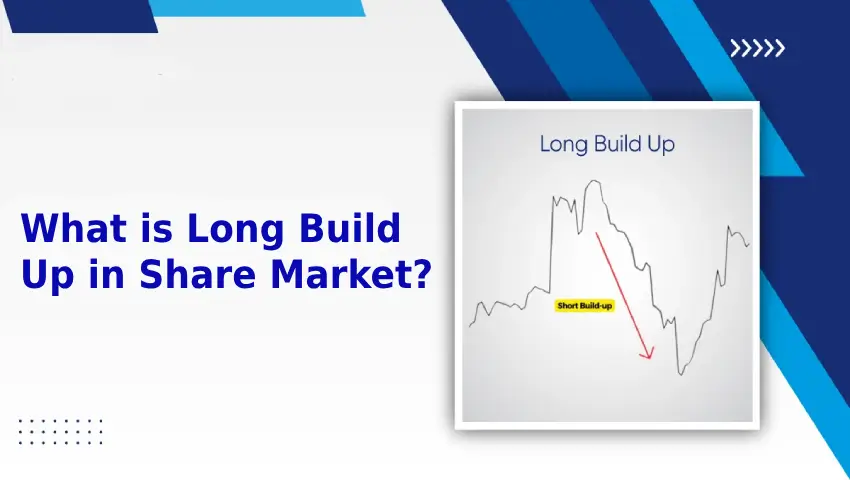
What is Long Build Up in Share Market?
When you trade in the share market, knowing where the market is heading is very important. One helpful clue traders use is called long build up. But what exactly does that mean?
In this blog, we’ll explain what long build up is, why it matters, how to spot it, and how it can help you make better trading decisions.
What is Long Build Up?
Long build up happens when the price of a stock goes up and at the same time, the open interest (OI) also goes up. This means more traders are buying and expecting the price to rise even more.
Let’s break it down:
- Open Interest (OI): Total number of futures or options contracts that are still open.
- Price Going Up: The stock price is increasing.
- Long Build Up: When both OI and price go up together — it shows traders are buying more, expecting profits as prices go higher.
Why is Long Build Up Important?
A long build up is usually a bullish sign, meaning the market is likely to move upward.
Here’s why it matters:
- Bullish Signal: It shows that big traders or investors are buying.
- Early Trend Clue: Helps you catch the uptrend early.
- Market Mood: It reflects that most traders are feeling positive about the stock or index.
How to Identify Long Build Up?
To find long build up, traders look at Futures and Options (F&O) data.
Look for this pattern:
Parameter Trend
Price Going up
Open Interest (OI) Going up
Volume Also going up (this is a plus)
Example:
Suppose stock XYZ is at ₹500. After a few days:
- Price becomes ₹550
- OI increases by 15%
- Volume is higher than usual
- This likely means a long build up is happening.
Example of Long Build Up:
Let’s look at another example with stock XYZ:
- Day 1: ₹1,350 | OI = 12 lakh contracts
- Day 2: ₹1,375 | OI = 13.2 lakh contracts
- Day 3: ₹1,400 | OI = 14.5 lakh contracts
Since both price and OI are rising every day, this shows traders are buying more — a clear case of long build up.
Long Build Up vs Short Covering:
These two are not the same!
Scenario Price OI Meaning
Long Build Up ⬆️ ⬆️ New buying (bullish)
Short Covering ⬆️ ⬇️ Traders exiting old short positions (bullish)
So while both are bullish, they mean different things.
Tools to Track Long Build Up:
You don’t need to be a pro to track long build up. Here are some useful tools:
- NSE website (for F&O data)
- Stock Edge app
- Money control & Economic Times Markets
- Trading View (for customized charts)
- Zerodha/ Sensibull & Fyers (for real-time F&O analysis)
Always use more than one source to confirm your findings.
Sectors Where Long Build Up Happens Often:
Some sectors where long build up is seen frequently:
- Banking (during interest rate updates or earnings)
- IT (after good results or global tech rallies)
- Pharma/FMCG (especially during uncertain times)
- Energy/Infra (after government policies or spending)
How to Trade Using Long Build Up?
Here’s a simple 5-step strategy:
- Find the Stock showing long build up
- Check Volume and Indicators like RSI or MACD
- Look for News/Triggers like earnings or policy changes
- Buy with a Stop Loss below recent support
- Exit on Warning Signs like price dropping or OI falling
Limitations of Long Build Up:
Keep in mind:
- False Signals can happen due to speculative traders
- Sudden News can change market direction quickly
- Needs Confirmation from other indicators
- Short-Term Use: Best for short to medium-term trading
Final Thoughts:
Long build up is a great tool to understand market direction. If used properly with other indicators and proper research, it can give you an edge in the market.
In short:
- Long build up = Price ↑ + Open Interest ↑
- It’s a bullish sign — traders are buying, expecting prices to go up
- Always combine it with volume, technical indicators, and market news
Note: This blog is for educational purposes only and is not financial advice.